
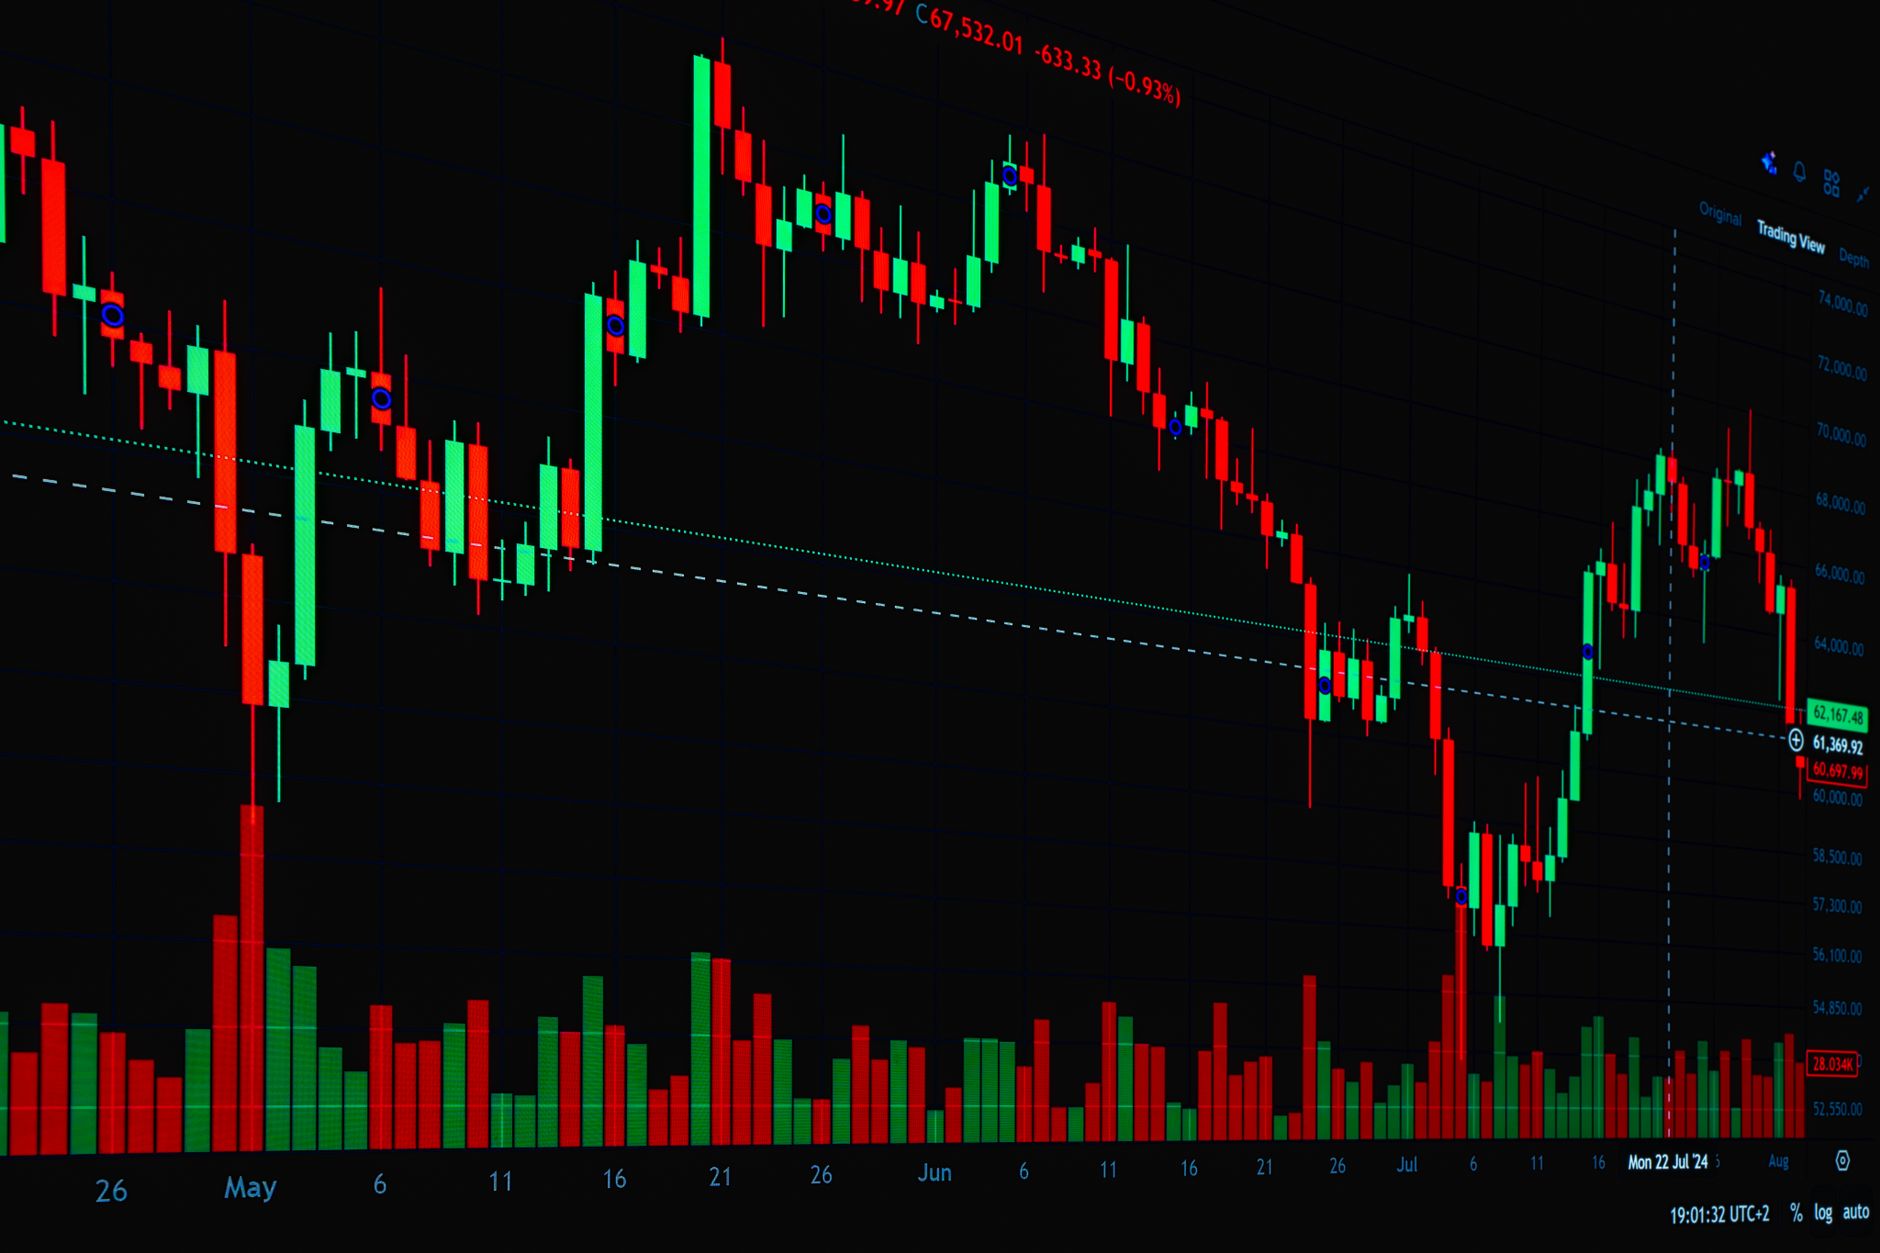
The Wyckoff method is a price analysis framework developed by Richard Wyckoff in the early 1900s. It was built around equities, but crypto traders have adopted it because the core logic holds: large, well-capitalised players accumulate or distribute assets before price moves, and they leave footprints in volume and price action that a trained eye can read. If you've ever tried to make sense of a sideways market before a sudden breakout, Wyckoff gives you a vocabulary for it.
The core idea: follow the "composite man"
Wyckoff described markets as if a single intelligent actor, the "composite man," were engineering price movements to shake out retail traders before making a directional move. This isn't a conspiracy theory. It's a model for thinking about how institutional accumulation and distribution look on a chart.
The composite man buys quietly during a downtrend, absorbing supply from panicked sellers. Once enough has been accumulated, price rises. On the other side, the composite man sells into strength, distributing to latecomers who are excited about the move. Price then falls. Understanding this cycle is the foundation of everything else in Wyckoff analysis.
The two key phases: accumulation and distribution
Wyckoff analysis centres on two market structures. Getting these right is where most of the practical value lies.
Accumulation happens after a sustained downtrend. Price enters a trading range where it stops making new lows. Volume contracts as sellers exhaust themselves. The key events are the preliminary support (PS), the selling climax (SC), and the automatic rally (AR). After those, price enters a "cause-building" phase inside the range. A spring, where price dips briefly below the range low to trap short sellers, often precedes the markup phase where price finally moves up.
Distribution is the mirror image. It follows an uptrend. Price enters a range where it stops making new highs. The buying climax (BC) and automatic reaction (AR) define the range. An upthrust after distribution (UTAD) fakes a breakout above the range before price collapses in the markdown phase.
Both phases can last weeks or months. That's the frustrating reality. Wyckoff isn't a short-term signal generator; it's a framework for identifying where you are in a longer cycle.
How volume confirms the picture
Volume is non-negotiable in Wyckoff analysis. Price without volume context is half the story. During accumulation, you should see heavy volume on the selling climax (large sellers hitting the market) followed by declining volume through the ranging period. When the spring occurs, volume is typically low, which tells you there's little genuine selling pressure underneath. The subsequent breakout should come on expanding volume.
During distribution, volume peaks at the buying climax. Supply is entering the market aggressively. Volume on any subsequent rallies should be lighter than on declines, signalling that demand is weakening. This is one practical reason understanding the difference between crypto volume and open interest matters: volume tells you how much trading activity accompanied a move, while open interest tells you about leveraged positioning. Both data points feed into a Wyckoff read.
Applying Wyckoff to crypto: where it works and where it doesn't
Crypto markets don't have a single exchange with consolidated volume data. That complicates Wyckoff analysis, which was designed for markets where volume figures were reliable and centrally reported. On-chain data partially fills that gap. Whale wallet movements, exchange inflows and outflows, and aggregated spot volume across major platforms give you something to work with.
Bitcoin and Ethereum, with their deep liquidity and broad participation, tend to produce cleaner Wyckoff structures than smaller altcoins. A low-cap token can look like it's in a Wyckoff accumulation but actually just be illiquid and ranging because nobody is trading it. Context matters. Apply the framework where volume is genuinely informative.
Funding rates are another useful overlay. Persistently negative funding during a price range that holds above key support is consistent with a Wyckoff accumulation thesis: shorts are paying longs, which suggests the market is positioned for continued downside that isn't arriving. When funding flips positive during a breakout, it can confirm that new buyers are piling in. This is one reason that reading on-chain funding rates alongside market sentiment adds a useful layer to Wyckoff analysis.
The three Wyckoff laws
Wyckoff formalised his thinking into three laws that underpin the whole method.
- The law of supply and demand. When demand exceeds supply, price rises. When supply exceeds demand, price falls. Obvious, but Wyckoff makes it operational by tying it to observable volume patterns.
- The law of cause and effect. A trading range (the cause) produces a proportional price move (the effect). A longer, wider accumulation range generates a bigger markup. This lets traders estimate price targets after a breakout by counting the horizontal width of the range on a point-and-figure chart.
- The law of effort vs result. If high volume (effort) produces little price movement (result), someone is absorbing supply or demand. This divergence between effort and result often signals the end of a trend or a turn within a range.
Common mistakes when using Wyckoff in crypto
Forcing the pattern is the biggest problem. Not every trading range is a Wyckoff accumulation. Sometimes markets are just quiet because nothing is happening. Traders who are determined to find the pattern will label every wiggle with a Wyckoff term and get burned when the range breaks the wrong way.
Ignoring higher timeframes is another common error. A structure that looks like accumulation on a 4-hour chart might be the "spring" phase of a much larger distribution on the daily or weekly chart. Always check the context one or two timeframes above what you're analysing.
Finally, Wyckoff analysis is not a complete trading system on its own. It doesn't tell you position sizing, it doesn't account for macro triggers like interest rate decisions or regulatory announcements, and it doesn't replace risk management. Australian traders should also keep in mind that the ATO treats every disposal as a CGT event, so even a profitable Wyckoff trade has a tax dimension. For a broader toolkit, it's worth pairing Wyckoff with the best tools for trading crypto rather than relying on any single method.
A practical starting point
If you're new to Wyckoff, start by reviewing Bitcoin's major accumulation phases on a weekly chart. The 2018–2020 bear market base and the 2022–2023 low both produced structures with recognisable Wyckoff characteristics: a selling climax, a trading range with declining volatility, a spring, and then a sustained markup. Work backwards on real data before you try to apply it in real time. Wyckoff analysis takes practice to calibrate, but the underlying logic, that informed money acts before price moves and leaves traces in volume, is as relevant in crypto as it ever was in equities.
General information only. This article is not financial advice. Crypto assets carry significant risk and past price structures do not guarantee future outcomes. Consider your own circumstances and, if needed, seek professional advice.