
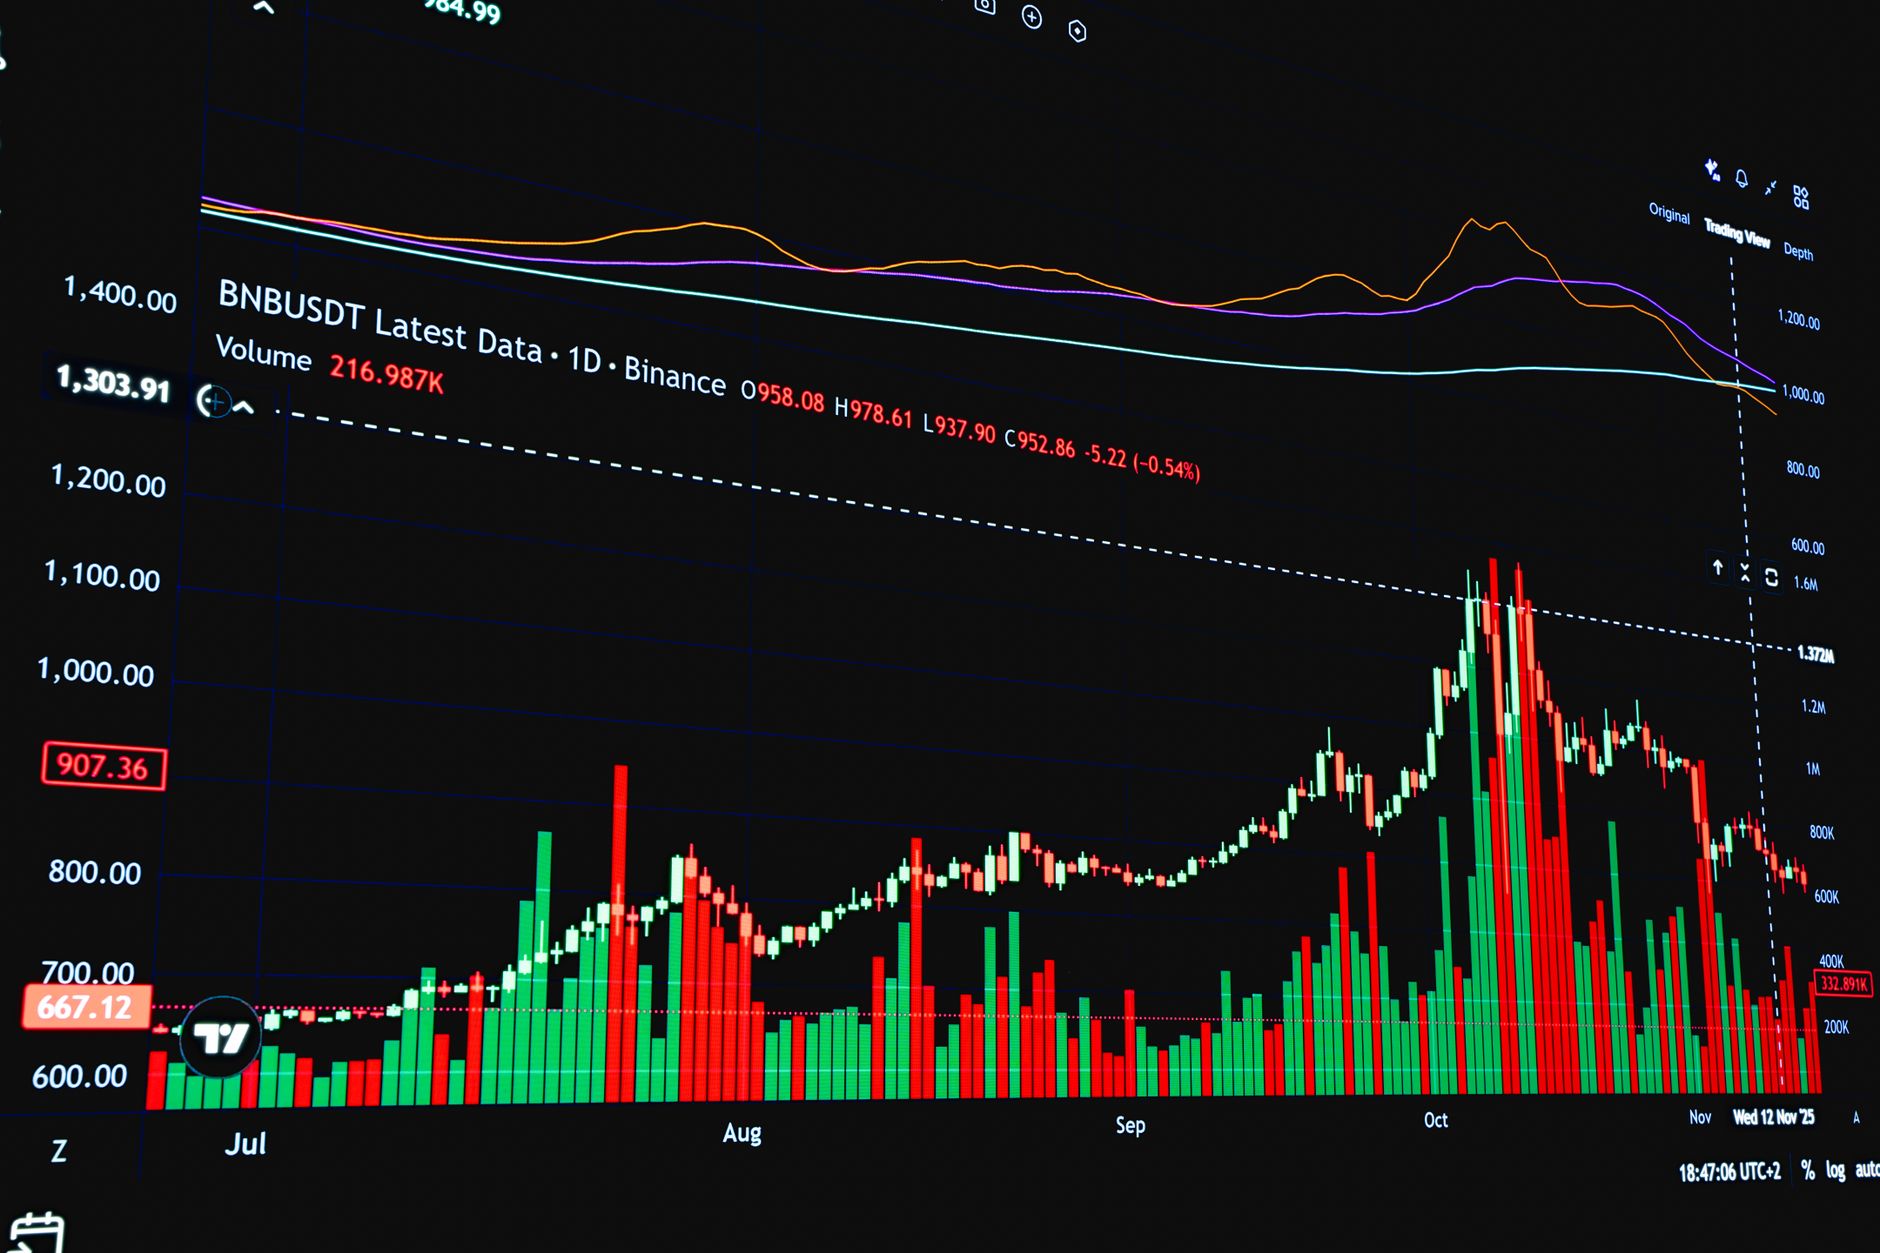
Bitcoin dominance is one of those metrics that experienced traders track religiously, yet newer investors often overlook it entirely. It measures Bitcoin's share of the total cryptocurrency market capitalisation, expressed as a percentage. When Bitcoin dominance rises, BTC is outgrowing the rest of the market. When it falls, capital is typically rotating into altcoins. Understanding how and why this number moves can sharpen your read on where the broader market is heading.
What Bitcoin dominance actually measures
The calculation is straightforward: take Bitcoin's market cap, divide it by the combined market cap of every tracked cryptocurrency, and multiply by one hundred. The result tells you how much of the total crypto economy is sitting in BTC at any given moment. In the early years of cryptocurrency, Bitcoin's dominance sat above 90%, because there were almost no alternatives. By mid-2026, the figure has settled into a range that reflects a far more mature and diversified market, with Ethereum, Solana, and a long tail of altcoins all claiming meaningful portions of total market value.
The metric is imperfect. New token launches constantly expand the denominator, which can drag dominance lower even if Bitcoin's own price is climbing. Stablecoins muddying the total cap figure is another known distortion. Despite these limitations, traders treat dominance as a reliable directional signal rather than a precise measurement.
Rising dominance: what it usually means
When Bitcoin dominance climbs, it typically reflects one of two conditions. Either Bitcoin is rallying faster than altcoins, pulling investors toward perceived safety in a broadly bullish environment, or the broader market is under stress and investors are retreating from riskier smaller-cap tokens into BTC. The second scenario is sometimes called a "flight to quality" within crypto, which sounds ironic given Bitcoin's own volatility, but is real relative to the behaviour of mid- and small-cap altcoins.
For altcoin traders, a sustained rise in dominance is often a warning sign. If BTC is absorbing an increasing share of market capital, altcoins are either stagnating or losing ground. Positions in smaller tokens tend to underperform during these periods, and liquidity can thin out quickly when sentiment shifts. The altcoin season of 2026 demonstrated this dynamic clearly: altcoins moved hardest precisely when Bitcoin dominance plateaued and began sliding, releasing capital into the broader market.
Falling dominance: reading the altcoin rotation
A declining dominance reading is the condition most altcoin traders are watching for. It suggests that capital is flowing out of Bitcoin and into other assets, which creates the environment known as altcoin season. Ethereum typically moves first as dominance falls, followed by large-cap layer-one tokens, and finally by mid- and small-cap projects.
The rotation is rarely smooth. Dominance can fall sharply during speculative surges, then snap back if sentiment sours. Traders who chase dominance signals too aggressively often buy into altcoin peaks, right as BTC stabilises and pulls attention back. The more useful approach is to treat falling dominance as a permissive condition rather than a guarantee: it widens the window for altcoin gains, but does not open it indefinitely.
Pairing dominance readings with other indicators adds context. On-chain funding rates can tell you whether the altcoin enthusiasm is driven by leveraged speculation or genuine spot buying. Elevated funding rates alongside falling dominance sometimes signal a crowded trade that is vulnerable to a sharp reversal.
How to track Bitcoin dominance in practice
Most charting platforms display dominance as a standard ticker (often labelled BTC.D). You can apply standard technical analysis to it just as you would a price chart: trend lines, support and resistance levels, moving averages. A common approach is to watch for dominance to break below a key support level as a signal that altcoin rotation is gaining conviction, or to watch for it to reclaim a prior support level (now acting as resistance) as a sign the rotation is stalling.
The 50-day and 200-day moving averages are particularly popular reference points among traders who follow this metric. When dominance crosses below its 200-day moving average, it has historically coincided with extended periods of altcoin outperformance. The reverse is equally true.
Bitcoin dominance versus Ethereum dominance
Some traders also track Ethereum's market share separately, since ETH often acts as the leading indicator for the broader altcoin rotation. When Ethereum dominance begins rising alongside falling Bitcoin dominance, it suggests capital is moving into the "quality" end of the altcoin market. When smaller-cap tokens start outperforming Ethereum as well, the rotation has broadened into full altcoin season territory.
Watching the interplay between these two dominance figures gives a more granular picture than Bitcoin dominance alone. Ethereum gaining ground at Bitcoin's expense is a different story to Solana or speculative meme coins taking the lead, and the risk profile for traders is very different in each case.
The Australian context: AUD pricing and tax timing
For Australian investors, dominance signals carry a practical dimension beyond the technical. The ATO treats every disposal of a crypto asset as a taxable event, including swaps from Bitcoin into altcoins. If you rotate from BTC into an altcoin on the basis of a falling dominance signal, you are crystallising a capital gain or loss on the BTC at the point of exchange. That has real tax consequences, particularly for investors who have held their BTC for less than twelve months and cannot access the 50% CGT discount.
Timing your rotations with an eye on the Australian financial year (July to June) is worth building into your process. A rotation made just before 30 June lands in the same tax year as any prior BTC gains. The same move made after 1 July sits in the next financial year, which may be preferable depending on your income situation. This is general information rather than personal advice, and it is worth speaking to a tax professional before making significant portfolio moves on dominance signals alone.
Common mistakes traders make with dominance data
The most frequent error is treating dominance as a standalone buy or sell signal. It is a market structure indicator, not a price predictor. A falling dominance reading tells you something about capital flows across the market, but it does not tell you which altcoin to buy, at what price, or with what sizing.
Another common mistake is ignoring the stablecoin effect. When market participants are cautious, they move capital into USDT, USDC, and similar assets. This can drag both Bitcoin and altcoin dominance down simultaneously, even though no genuine altcoin rotation is occurring. Stripping stablecoins from the calculation (some platforms offer this view) gives a cleaner signal during periods of uncertainty.
Finally, traders sometimes conflate dominance trends with absolute performance. Bitcoin's dominance can fall while its price is still rising in AUD terms, simply because altcoins are rising faster. If your goal is AUD returns rather than relative outperformance, the dominance chart is a useful context tool, not the primary decision framework.
Used correctly, Bitcoin dominance is one of the more reliable macro lenses in a crypto trader's toolkit. It does not replace price analysis, on-chain data, or risk management, but it gives you a structural view of where market energy is concentrating. For Australian traders watching the market in 2026, keeping one eye on the BTC.D chart alongside your individual position analysis is a habit worth building.